A spectrum analyzer is a digital device or graphical instrument. It is operated to measure, analyze & visualize RF signals over a certain range of frequency. The use of these instruments is quite wide. From analysts, technicians, academics to hobbyists most of them are vastly dependent on this specially designed device. Therefore, having the best spectrum analyzer is quite important for various applications.
This particular device doesn’t only display some measurements and analyze signals, sometimes some of the models also act as signal generators too. Even though they are not very complicated to use, knowing the details about such precise instrumental data matters. That is why we have come up with a complete descriptive article on digital spectrum analyzers and hopefully, it might come in handy.
Top 5 Picks: Buy Spectrum Analyzer


Last update on 2026-01-14 / Affiliate links / Images from Amazon Product Advertising API
Our Favourite Digital Spectrum Analyzer Picks
After spending enough hours & hours of research and analyzing hundreds of spectrum analyzer reviews available on the internet, we have managed to come up with a shortlist of best handheld spectrum analyzer for your help. Here they are;
- Siglent SSA3021X
- Rigol DSA815
- OSCIUM WiPry 2500x
- GQ EMF-390
- SEESII Portable TinySA
- AURSINC Portable TinySA
Comparison Table
For a better and clear understanding of the products we have mentioned here, a comparison among them would surely help you from a distinguishing aspect. Therefore, we have plotted a comparison chart among these best digital spectrum analyzer below-
| Spectrum Analyzers | Frequency Range | Bandwidth Resolution | Material | Weight |
| Siglent SSA3021X | 9 kHz to 2.1 GHz | 1 Hz to 1 MHz | Plastic | 10.10 pounds |
| Rigol DSA815 | 9 kHz to 1.5 GHz | 100 Hz to 1 MHz | Metal | 11.77 pounds |
| OSCIUM WiPry 2500x | 2.4 to 2.495 GHz & 5.15 to 5.85 GHz | 2.4 GHz: 333 KHz. 5 GHz: 1.665 MHz | Canvas | 1.59 ounces |
| GQ EMF-390 | up to 10Ghz ( radio,electric,electromagnetic field) | 812 kHz | Plastic | 10.0 ounces |
| SEESII Portable TinySA | 0.1MHZ-350MHz (MF/VHF/HF) 240MHz-960MHz (UHF) | 2.6kHz and 640kHz | ABS | 8.78 ounces |
| AURSINC Portable TinySA | 0.1MHz to 350MHz (MF/HF/VHF) 240MHz-960MHz (UHF) | 2.6kHz and 640kHz | ABS | 1.76 ounces |
6 Best Spectrum Analyzer Review 2022
1. Siglent SSA3021X

Siglent SSA3021X is one of the most popular & best digital spectrum analyzers among numerous signal analyzers. This is a lightweight portable electronic gadget that comes with a wide range of frequencies from 9 kHz to 2.1 GHz. It is also available with Tracking Generator (TG) & All- Digital IF technology.
It has a larger display of 10.1 inches compared to other spectrum analyzers. Including a Minimum Resolution Bandwidth (MRB) of 1 Hz, it also features more analysis functions like VBW, Span, Markers & basic signal demodulation. Besides, the Siglent spectrum analyzer provides the internal memory of 365 MB as well.
Key Features
- The Siglent SSA3021 features a wide range of frequency that is from 9 KHz up to 2.1 GHz. No other spectrum analyzers provide such a wide frequency range.
- Provides a 10.1 inch TFT LCD display with the noise level of -161 dBm/Hz. Besides, the offset phase noise is pegged at -98 dBc/Hz at 10 kHz of this unit.
- It offers an overall of +/- 0.7 dB of amplitude accuracy that is proved to be quite suitable for several applications.
- This spectrum analyzer is available with a minimum Resolution Bandwidth (RBW) of 1 Hz that turns out to be very helpful while operating it.
- Its standard preamplifier makes it a lot easier to achieve an adequate amount of signal amplification.
Pros
- A tracking generator is available.
- Can extend this spectrum analyzer to 3.2 GHz with a firmware modification.
- Includes a Standard Preamplifier.
Cons
- Gets easily overloaded with strong signals.
2. Rigol DSA815
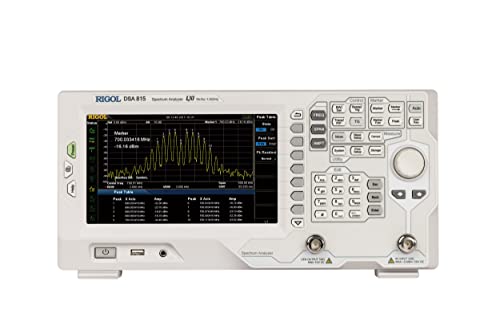
Rigol DSA815 is one of those best rf spectrum analyzer that an RF engineer would recommend buying. It is available with a frequency range of 9 kHz to 1.5 GHz that also allows it to monitor some WiFi signals. This unit used to be one of the topmost sell-out spectrum analyzers back in 2012-2014. Besides, IF (Intermediate Frequency) technology ensures reliable performance while meeting most of the RF applications.
Along with a large display (20.3 cm/ 8 inches) with a noise level of -135 dBm. The monitor with a very high-quality resolution helps with detecting all types of beneficial signals like Auto Range, Auto Couple, Auto-Tune, and Auto Scale. It also has a resolution bandwidth (RBW) of 10 Hz. Moreover, it offers a Preamplifier & is a spectrum analyzer with Tracking Generator (1.5 GHz) as well.
Key Features
- The Rigol DSA815 comes with a wide frequency range varying from 9 KHz to 1.5 GHz. This wide range even helps it with monitoring WiFi signals quite well.
- Because of its 1.5 GHz Tracking Generator, tracking would be a very easy function to deal with.
- Its 8 inches large display has a very fine resolution of 800×400 pixels that makes it quite a comfortable viewing device.
- This spectrum analyzer is not only a well featured machine but also a lightweight and compact unit too. It weighs about 11.9 pounds.
Pros
- Comes with a 1.5 GHz Tracking Generator
- Lightweight & compact
- Features Preamplifier
- Top quality instrument at cheap price
Cons
- Lack of sensitivity
- Unlocking features (VSWR) charge extra money.
3. OSCIUM WiPry 2500x
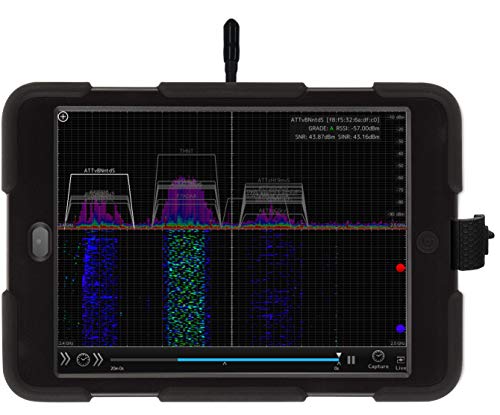
The Oscium WiPry 2500X is a specially designed spectrum analyzer for WiFi signals. The analyzer has a frequency range of 2.4 GHz and 5 GHz within which the WiFi operates as well. It also analyzes the signals created from the baby monitor, Bluetooth connection and Zigbee, etc.
This tool comes up with solutions for several issues to improve the WiFi speed & reliability such as, avoiding interference & locating its source, optimizing channels, etc. It is actually tiny & simple hardware that works along with the app, as Oscium Wipry 2500x is compatible with iOS, Android, PC, and Mac.
Therefore, it implies the fact that you can use it on several devices. For solving the plugging issue it comes with three different USB cables (Type- C, Type- B & Type – B mini). Besides, a ruggedized carry case is also available with it.
Key Features
- The Oscium Wipry 2500x operates with a double antenna within the frequency range of 2.4 GHz and 5 GHz. That means it can analyze the WIFi signals too.
- Specially designed to not only analyze WiFi signals but also signals from baby monitor, Zigbee, Bluetooth connection etc.
- Simple and small device that can work along apps. Interestingly it can work with both iOS and Android devices.
- It is available with 3 different cables so that it can be used in all kinds of devices.
Pros
- Compatible with both iOS & Android devices.
- Improves WiFi reliability & speed.
- Powerful & portable
Cons
- Doesn’t cover Z band.
4. GQ EMF-390
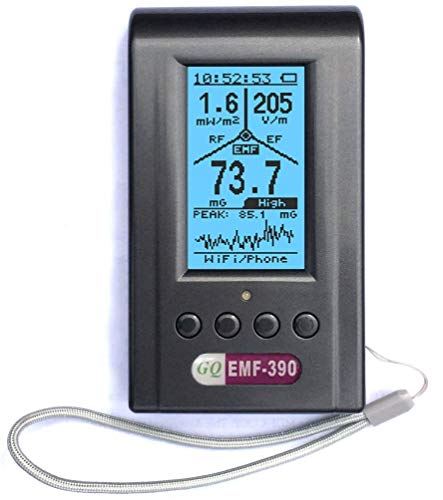
The GQ EMF- 390 advanced multi-functional digital spectrum analyzer is originally designed & developed by GQ Electronics, USA. This portable yet convenient device is used in various scientific applications and also in testing or detecting WiFi, Smart meter, Cell phone, 2G/3G/4G/5G Cell tower, Microwave, etc. It is available with multiple sensors having high sensibility for identifying the power source of those numerous signals & all.
RF Spectrum Power analyzer comes as a bonus feature along with it. The response time of the RF browser is ultra fast as the RF detector can detect 5G signals in 250 nanoseconds. For data logging the GQ EMF- 390 has built-in flash memory that can log real-time data per second with a timestamp. Moreover, multiple sensors, USB cables, rechargeable (internal) 3.7V battery, etc are also available with it.
Key Features
- This spectrum analyzer features an all-in-one display that makes it quite easier to read the datas from all the sensors at once.
- Its advanced multi-functional features & sensors ensures the quality detection from EMF, RF radiation, EF etc.
- It offers an RF detector having an ultra-fast response time in detecting 5G signals & RF up to 100Hz in 250 ns.
- The QG EMF- 390 can detect the common sources of Power line, Smart meter, Cell phone, Microwave etc.
Pros
- Provides Real-Time EMF EF Graph
- Features Real-Time Power Distribution Histogram
- Has open communication protocol
Cons
- A bit weak in detecting signals from 360 degrees
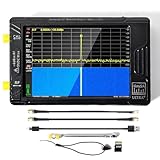
5. SEESII Portable TinySA
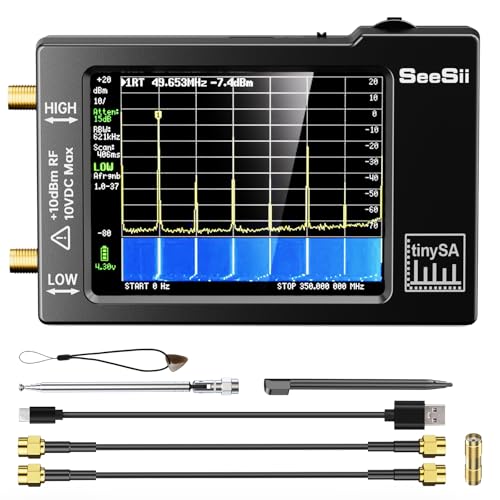
When it comes to portable digital spectrum analyzers with high-functionality that would also be budget-friendly then the SEESII Portable TinySA is the one to pick. Because of it being so tiny and portable, for any application, one can carry it anywhere without any trouble at all.
This ultra-small spectrum analyzer covers a frequency range of 100 kHz to 960 MHz. It has dual functionality. It operates as a spectrum analyzer & signal generator both. This tiny unit can be used as a PC-controlled SA once it is connected to the PC via a USB cable.
The SEESII Portable TinySA comes with two inputs, high quality MF/HF/VHF input (0.1 MHZ – 350 MHz) & UHF input of lesser quality (240MHz-960MHz). For automatic self-test and low input calibration, it has a built-in signal generator. Including a color display, it also features an inbuilt rechargeable battery that allows a minimum of 2 hours’ portable use.
Key Features
- The SEESII tinySA is a tiny sized spectrum analyzer that is primarily designed for a frequency range of 100 kHz to 960 MHz.
- It functions as a spectrum analyzer and also as a signal generator. When it is not used as an SA unit, it can be used as a signal generating unit.
- Two inputs are available with it which includes a high quality HF/VHF/MF input ranging from 0.1 MHz to 350 MHz and lesser quality UHF input ranging from 240 MHz to 960 MHz.
- It comes with a Switchable resolution bandpass that acts as a filter between 2.6kHz and 640kHz for both ranges.
- Comes with a rechargeable built-in battery & it provides 2 hours of backup for portable using. Besides, this tiny SA unit can be controlled by a personal computer just by connecting it through the USB port.
Pros
- Acts as both spectrum analyzer & signal generator
- Built-in rechargeable battery is available
- 2 hours of backup
- Tiny in size
- Comparatively cheap spectrum analyzer
Cons
- Frequency coverage is limited
- UHF input quality is not that good (240 MHz to 960 MHz)
- Sensitivity is not high-quality
6. AURSINC Portable TinySA

AURSINC Portable TinySA is one of the best handheld spectrum analyzers that is quite popular in the market. It offers dual functionality both as a spectrum analyzer and a signal generator.
It comes with two types of input, high quality HF/VHF/MF & lesser quality UHF input that are ranging from a frequency of 0.1MHZ-350MHz and 240MHz-960MHz respectively. Besides, for both ranges between 2.6kHz and 640kHz, it features switchable resolution bandpass filters.
4 different modes (Low input mode, High input mode, Low output mode, High output mode) are available for the input & output specification of this ultra-small handheld spectrum analyzer. The user can update the firmware of the tiny. Moreover, the screen of the AURSINC Portable TinySA can be captured in both Linux & Windows PC.
Key Features
- The AURSINC Portable TinySA features a dual functionality option. It acts both as a spectrum analyzer and a signal generator.
- It provides two different types of input. The high quality (VHF/MF/HF) for a frequency range of 0.1MHZ-350MHz and the lesser quality UHF input ranging from 240MHz-960MHz.
- This SA unit comes with a total of 4 different modes for the input & output specification which includes High input mode, Low input mode, High output mode, Low output mode).
- A built-in calibration signal generator is available with it. The user can use it for low input calibration & automatic self test.
- The portable TinySA offers a colour display and is also operable in both Linux & Windows PC.
Pros
- 4 input & output modes are available
- PC controlled
- Dual functionality
- Thin & finely fits in hand
Cons
- Limited Frequency coverage
How to Choose Best Spectrum Analyzer- Buying Guide
There are numerous things you should pay attention to before purchasing a spectrum analyzer. The market is swarmed over by hundreds of such units with myriad features and models. We have tried to mention some key factors here that seem quite important before buying one.
Budget
For buying a budget spectrum analyzer that has a wide price range, price is always an issue. You obviously shouldn’t go beyond your limit and then regret it after purchasing an expensive spectrum analyzer. Rather having a cheap signal analyzer with a smart evaluation of your desired unit and knowing details about the features it offers would be a far better option.
These spectrum analyzers are available from $100 to $12000 even more. But it is also true that if you look for exclusive features and high-end options you have to pay more money than the regular amount.
Specifications
The spectrum analyzers generally come with lots of features. A few of them are partial if not exactly the same in most of they but still have a lot of differences in so many aspects. Having top-notch & high-quality features makes the device more reliable and sometimes multi-functional too.
For example, frequency range, dynamic range, bandwidth, sensitivity, power input, average noise level, etc. So, before purchasing such a unit, you have to ensure that the features you are seeking are available in the instrument.
Display
A large & convenient display with sharp & color imaging is one of the most important things to look for in a spectrum analyzer. Nowadays, the SA units offer to play in various colors so there will be enough options to pick from. Besides, a display must be responsive to user input where it is necessary.
Usability
No matter how modernized features are being offered, if a device is not user-friendly then it loses the attraction. Therefore, usability is a prime factor to look at while buying a spectrum analyzer unit. The ones we mentioned above, all come with higher standard usability.
How to Use a Spectrum Analyzer
Frequency, bandwidth, and power all play a role in RF signals. These things must be set before viewing an RF signal:
Setting up the Spectrum Analyzer:
- Center the desired signal by adjusting the center frequency. The most common way to do this is to enter a known carrier frequency. In addition to using knobs or arrow buttons, the Marker-to-Center function can also be used.
- The span should be set right so that half of the screen is covered by the desired signal.
- To increase the screen’s top of signal, raise the reference level.
Using the Spectrum Analyzer:
1. Input Signal
- As soon as the loopback circuit is set up, the analog output pins need to be applied a signal. This will be accomplished with the Wavegen instrument provided by WaveForms.
- By choosing the Welcome page tab at the top of the screen, you will return to the Spectrum Analyzer instrument.
- Right-click on the Wavegen instrument in the Welcome tab (red arrow in the image at right). You can start generating a signal by clicking the Run button near the top of the control bar (red box in image at right).
- Wavegen Channel 1 output pin is set to output a sine wave of 1V (2VPP), 1kHz by default. Enter the value 500kHz in the Frequency field, including the SI prefix, via the drop-down menu.
- In the upper bar of the screen, click on the Spectrum Analyzer instrument to return there.
2. Start collecting data
- You may now begin capturing data on the analog input channels by clicking on the Run button in the control bar.
- The plot pane displays the captured data in the form of colored lines. In the image at right, the yellow line (labeled 1) illustrates the signal captured on channel 1 of the analog input.
- Analog input channel 2 is represented by the blue line.
3. Axes of the plot pane
- The horizontal axis of the plot is frequency in MHz, and by default, the vertical axis is decibel voltage (dB*). The values can be altered using the control bar located above the plot plane, or by changing the settings found on the Configuration Panel.
4. Cursors for quick measurement
- Click the Quick Measure vertical icon at the top right side of the plot pane to quickly measure the period and frequency of the sine wave.
- Observe the values displayed when you move the cursor over the plot pane.
- By clicking the Stop button in the top-right control bar, you can stop capturing data if the values change too quickly for you to keep up.
- By clicking the Quick Measure: Vertical button again, you will be able to remove this cursor.
FAQ
What is the difference between a spectrum analyzer and a signal analyzer?
Basically, a Signal analyzer provides extensive demodulation capabilities for analyzing signals with complex & digital modulation. On the other hand, a spectrum analyzer displays & measures signals with analog modulation.
What does a spectrum analyzer show?
A spectrum analyzer measures the value of an input signal against the frequency within the full range of the unit. The fundamental application is to measure the power of the spectrum of signals that are either known or unknown.
What is frequency span in a spectrum analyzer?
The frequency span signifies the range between the starting and ending frequencies. For adjustment of the display within the range of the frequency of the spectrum analyzer, these two parameters allow enhancing visibility of the measured spectrum.
Can a network analyzer be used as a spectrum analyzer?
The differences occur in the process of measuring the signals. When a spectrum analyzer starts analyzing an applied signal, then a network analyzer starts creating a signal. Along with that, it characterizes the already set up devices that will receive it. On the other hand, the spectrum analyzer is operated mainly to measure the power carrier level, noise harmonics & many more.
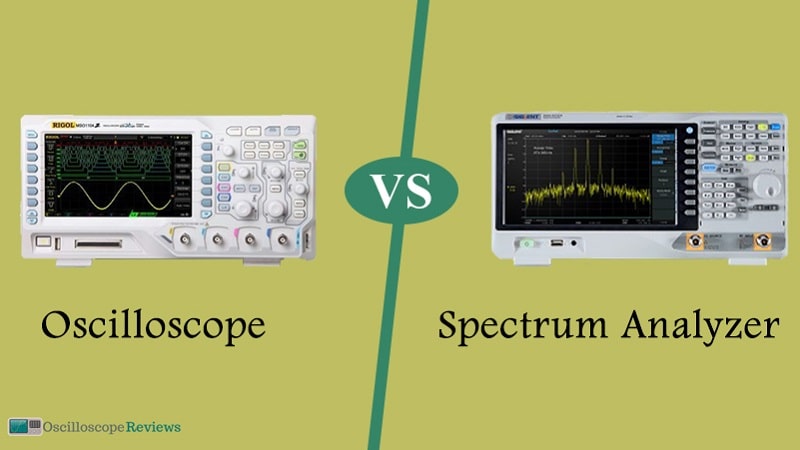
What is the difference between a spectrum analyzer and an oscilloscope?
Basically, with respect to time, an oscilloscope displays a signal. But a spectrum analyzer displays it against a particular frequency. An oscilloscope is generally used for finding the delay of relative time between two signals. On the contrary, you’d need a spectrum analyzer for observing a signal’s frequency properties.
Final Verdict
Purchasing a spectrum analyzer can really be a tricky task. It may seem a bit difficult to have an eye for those technical specifications if you are not well informed about them. But when you have got the right instructions with authentic descriptions on those devices, things may seem quite easier.
Our purpose is to provide you with a proper guideline which we have tried through this review article. If you ask us for a suggestion then, the Siglent SSA3021X spectrum analyzer would be our top pick. But according to your necessity and required specifications, you can always pick the right one from the shortlist.
Good Luck!!!
-
The primary difference between these two instruments is that with an oscilloscope, you can see…
-
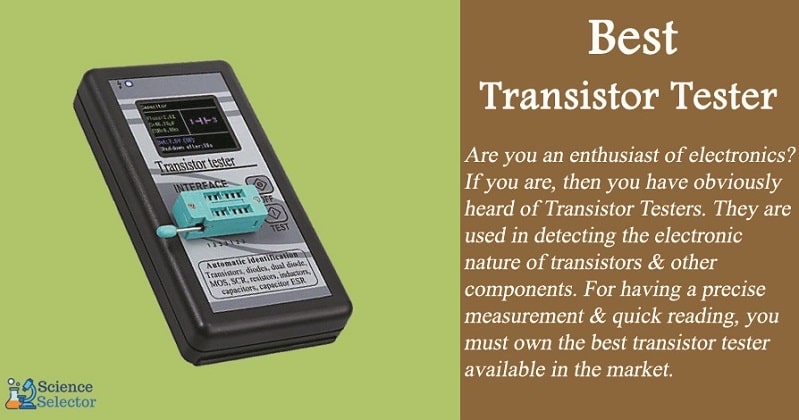
Are you an enthusiast of electronics? If you are, then you have obviously heard of…
-

Logic analyzers are better alternatives to oscilloscopes—they can accurately measure data on a bus and…
-
Have you ever been in any situation where you just needed that extra range to…
-
You may think that you’re already someone who can deal with all your DIY projects.…
-
Most people like you, who are in constant need of precise measurements, are fond of…
-
Frequency counters help to count the high-frequency signals transmitted by two-way radios. Anyone who uses…
-
There are many oscilloscopes models on the market, and finding the best can be tricky…