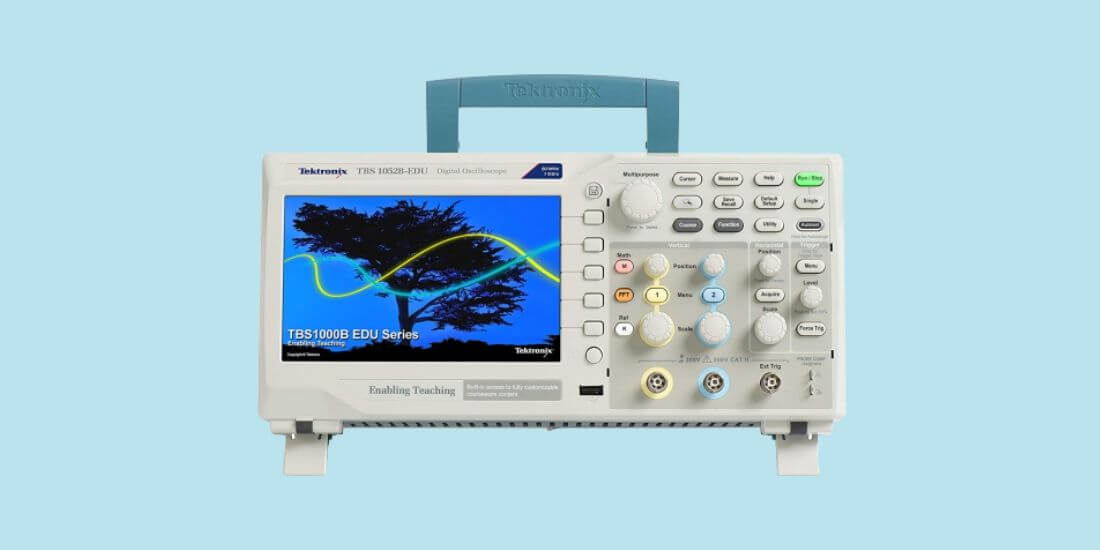
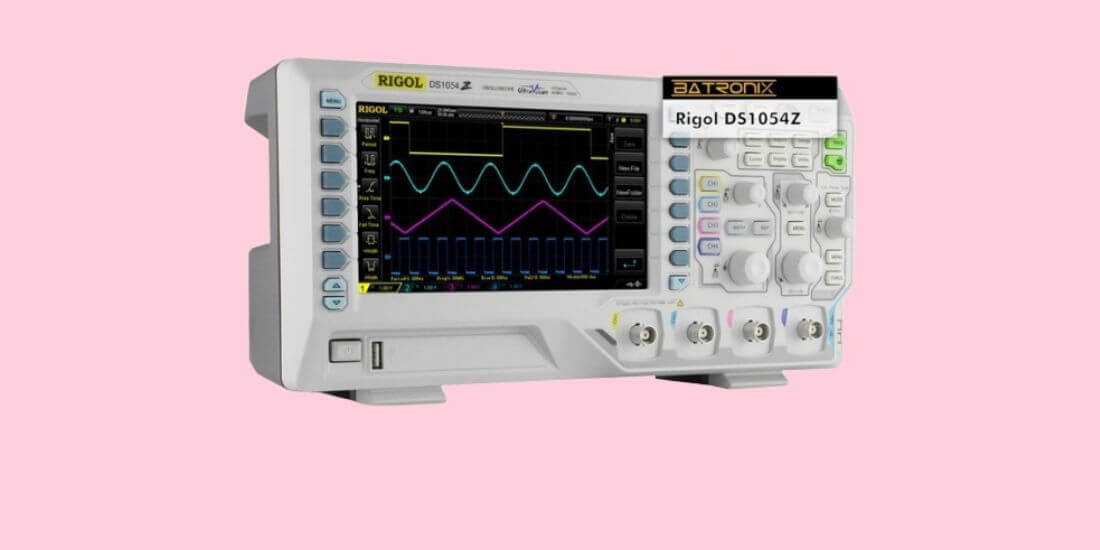
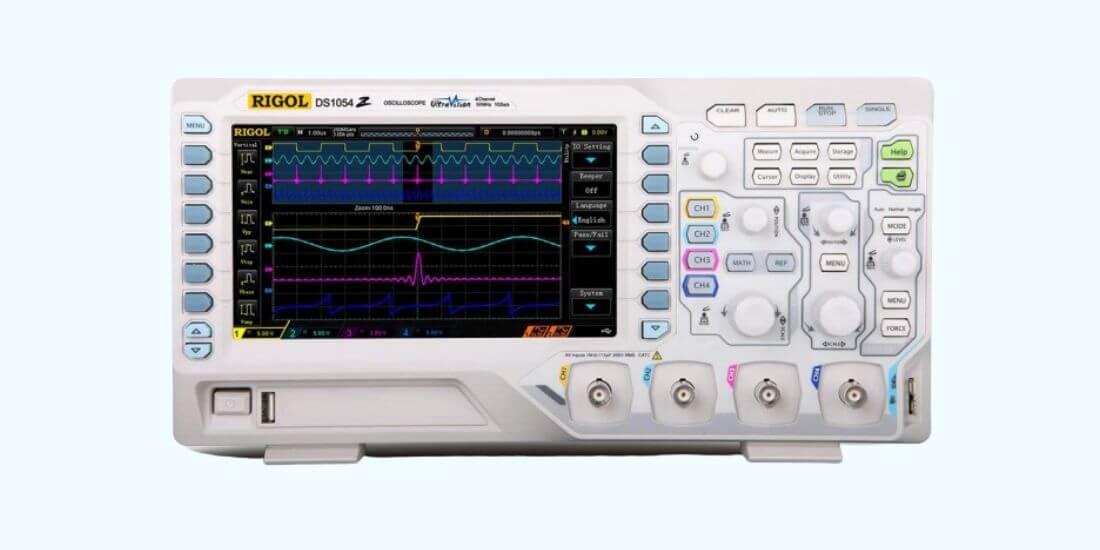
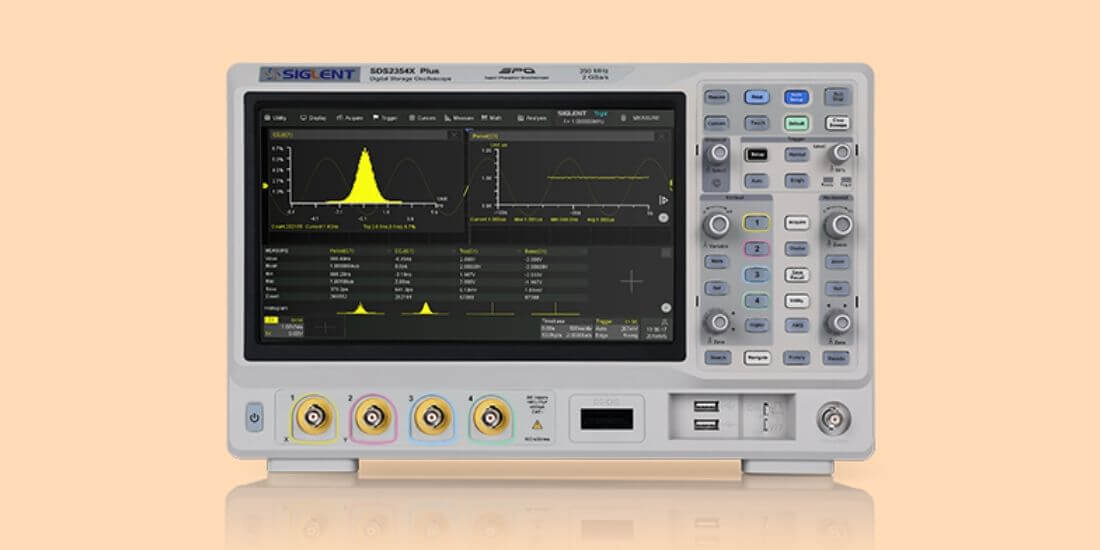
An oscilloscope is a device used to view the voltage of an electrical component in the form of waves on a screen. It consists of a screen, input ports, and several controls. Oscilloscopes can be either analog or digital.
Most current oscilloscopes will provide you with the readings for voltage and frequency. They usually have other statistical information such as standard deviation and mean.
That said, if your budget oscilloscope does not have these features, you could manually calculate the frequency by yourself.
So, let’s learn how to calculate the frequency from the oscilloscope.
Oscilloscope, also known as O-scope or simply just scope informally, is an incredibly useful tool for engineers and regular people alike.
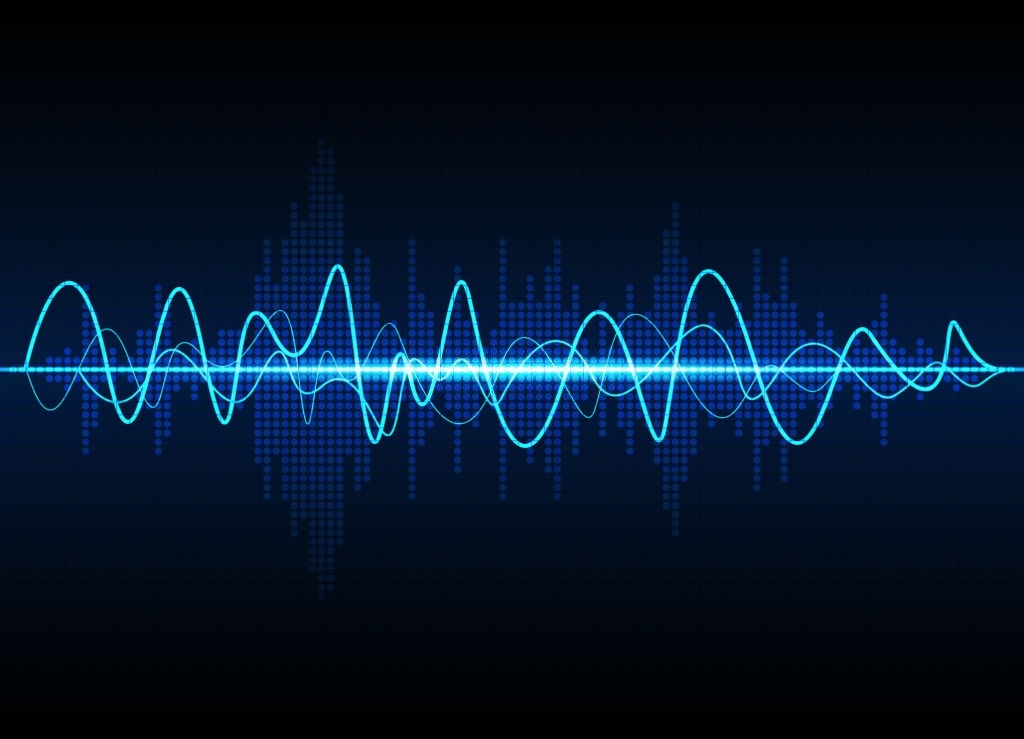
It is used to display the varying signal voltages of an electric signal and how it changes over time. An oscilloscope’s bandwidth is what represents its frequency.
So when we are talking about the frequency of an oscilloscope, we are actually talking about its bandwidth. To learn what is frequency oscilloscope and what certain level frequencies can do to your oscilloscope reading, check out the next section.
What Is Frequency and How Is It Represented?
The frequency of an oscilloscope indicates the level of frequency you can calculate with it. It is represented by bandwidth.
Bandwidth is often considered to be the oscilloscope’s single most critical feature, and that is justified. Measured in Hertz, the bandwidth of an oscilloscope is the span of frequencies it can precisely calculate.
If you do not have enough bandwidth, your signal’s amplitude will be incorrect & your waveform details may get lost.
On the contrary, if you have too much bandwidth, you can detect unnecessary noise, thereby providing you with an incorrect calculation.
Why is that you may ask? Well, to answer, think of your oscilloscope as a low pass filter, which only allows frequencies up to a certain limit to pass.
Low pass filters allow the signals to pass in maximum possible amplitude before the frequency of the signal reaches the higher end of the frequencies that the filter allows to pass.
Then, a filter attenuates the signals that pass through them right to the point when the amplitude of the signal is dampened to nothing.
When the signal reaches three decibels upon attenuating, you have reached the cutoff threshold of your oscilloscope’s bandwidth specification.
Say, your oscilloscope has a bandwidth of 200 mega Hertz, and you know now that it means that the filter of your oscilloscope has a cutoff frequency of 200 mega Hertz.
Why should this knowledge matter to you? Read the next sections for an answer to that.
Calculating Frequency Using an Oscilloscope
Let’s go through the entire process.
Enlarging Display Area
Start by making sure the signal area on your oscilloscope’s display is enlarged.
Measuring Time
Then, measure the time value using the horizontal scale of your oscilloscope, and also by counting the number of divisions (horizontally) between the two ends of a wave, along the Center Horizontal Graticule Line.
In simpler words, this means to count the number of divisions between the peak points of the waves on the waveform of your signal (or a part of the signal’s waveform whose frequency you wish to calculate).
Multiplying
The next step is to multiply this number of horizontal divisions by the time/div value to find the signal’s “period”. And the period of a wave is the amount of time it takes for the wave to complete a full cycle.
Using Formula
Now that you have all your elements, you can use a simple formula to find out the frequency of the waves. This formula will have you divide the value 1 by the period of the wave (or waves) in order to calculate the frequency. So, the formula for this would be: frequency = 1/the period of a wave.
The Consequence of Too Much Frequency
You can capture noise from the environment with your oscilloscope. When doing so, the oscilloscope will add noise to the signal when it is being filtered, processed, and then digitized. This noise addition takes place at all frequencies.
So, with your 200 mega Hertz oscilloscope, it will show noise up to 200 mega Hertz only; on the other hand, if your oscilloscope has 30 GigaHertz bandwidth, it will add noise to the measurement all the way through its entire range of frequency regardless of the frequency of the signal.Thus, your signal will have a lot of noise.
Another reason you would not want to get too high of bandwidth is that they cost a lot more. Basically, the higher the bandwidth of the oscilloscope, the greater the price will be.
What if there are possibilities that you might need higher bandwidth in the future? Get an oscilloscope with the feature that lets you upgrade the bandwidth through purchasing a software license.
That way, your oscilloscope will not become obsolete, and you can still get usage out of it without needing to purchase an entirely new one.
Related Guide: OSCILLOSCOPE UNDER $1000 REVIEW
The Consequence of Too Little Frequency
If you attempt to measure a signal with a higher frequency than the oscilloscope’s cutoff frequency, you will either get a distorted and attenuated version of the signal or not get much of a signal at all.It isn’t even a good idea to measure a signal with as high a frequency as the highest scope of bandwidth.
If you try to measure a 200 mega Hertz signal with a 200 mega Hertz oscilloscope, you will not get the best representation of the signal as the filter will have already started to distort the input due to reaching the maximum frequency.
Although there are many essential features of an oscilloscope that you will need to check before you pick one for your measurements, obviously, bandwidth is the most important spec you will need to review before any other. Without a good bandwidth range, you will not get an accurate and clean measurement at all.
Oscilloscopes and Frequency
Essentially, an oscilloscope visualizes electronic signals (or voltage) passing through a component (such as a wire). It does so by turning the electronic signals into a graph on its display screen, where the voltage is displayed on the vertical axis, and the time is measured on the horizontal axis of the graph.
Most oscilloscopes can display both AC (alternating current) and DC (direct current) waveforms.
The time and voltage units on most oscilloscopes can be adjusted from seconds per division (s/div) to nanoseconds per division (ns/div) and from volts per division (V/div) to microvolts per division (μV/div), respectively.
Measured in hertz, frequency is the number of times oscillating waves pass a certain point on the graph every unit of time (so, for example, five waves per second).
Finding out the frequency of a voltage waveform can be useful for myriad reasons. The most common of them being that, when the frequency of the waveform of a component’s voltage is measured, it can tell us whether the component is working as it should be or if its voltage needs to be fixed.
Conclusion
As mentioned before, finding out the frequency of a waveform is only a matter of navigating on a screen in the case of most modern oscilloscopes.
However, if needed, this frequency can also be worked out manually using the few steps mentioned above.
-
A very usual sight in a lab is the presence of a device known as…
-
If you have ever been to an electronics laboratory at your university, you have definitely…
-
An oscilloscope is a powerful diagnosis and measuring tool for electric circuits. The advantage that…
-
Working with electrical appliances and designing flawless circuits is critical on its own. On top…
-

One of the best ways to ensure the safety and efficiency of your electronics is…
-
Looking for a quality oscilloscope isn't easy. At first glance, it's hard to differentiate, and…
-
Oscilloscopes are instruments used in the laboratory which is used to analyze waves of electronic…
-
Electrical devices are sensitive. Building one from scratch is even more tedious. Small errors here…